Using the Cloud Platform Monitoring and Alerting stack
Introduction
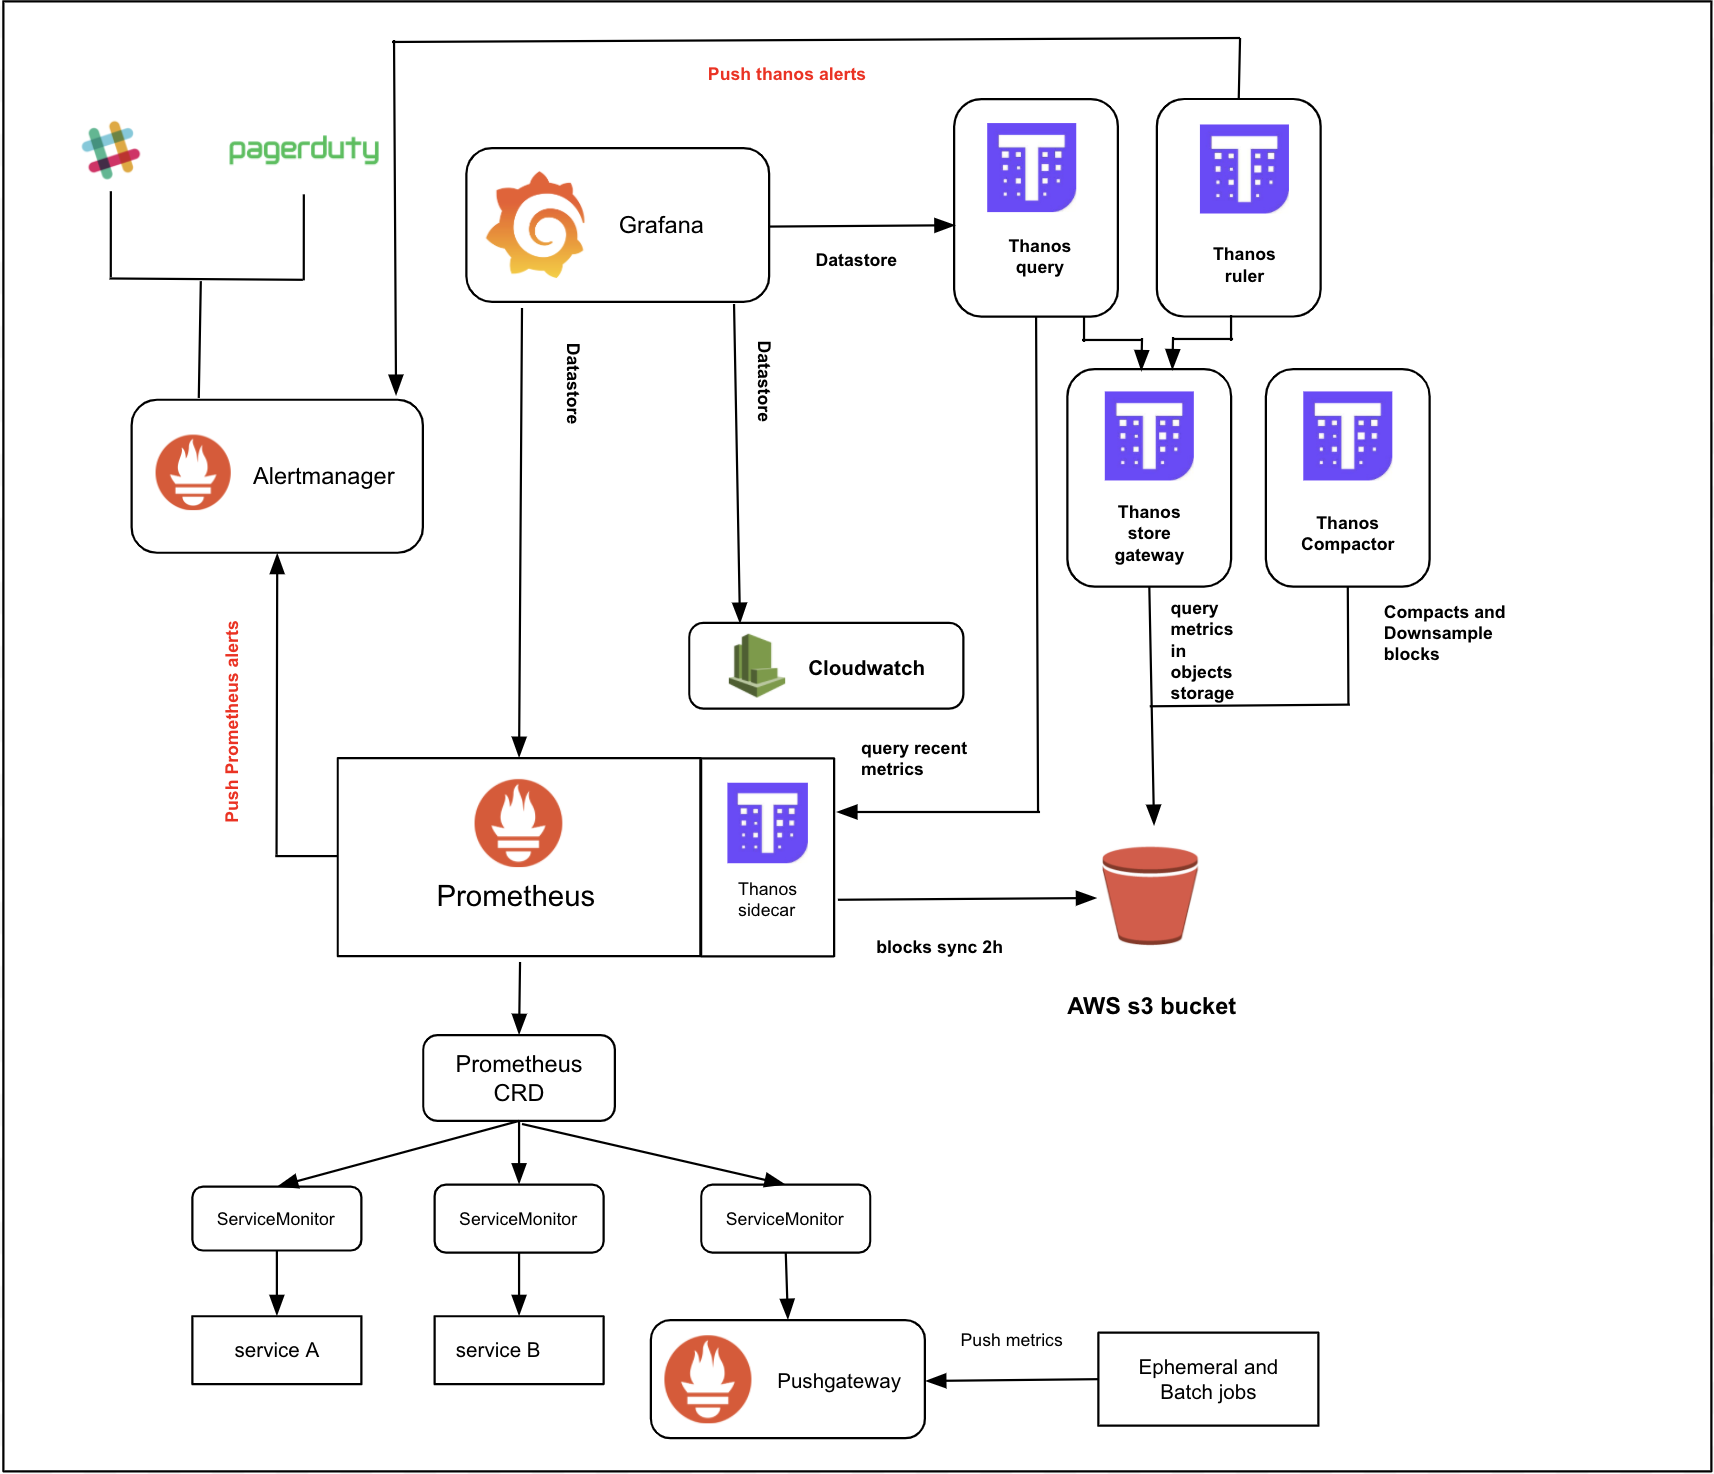
This is a brief introduction to the Cloud Platform Monitoring and Alerting stack: Prometheus, AlertManager, Grafana, Thanos and Pushgateway.
Below is a high-level overview
Prometheus
Prometheus is an open-source systems monitoring and alerting toolkit originally built at SoundCloud. The Cloud Platform uses Prometheus Operator from CoreOS which allows a number of Prometheus instances to be installed on a cluster (although we currently use a single Prometheus instance for the whole cluster).
Prometheus scrapes metrics from instrumented jobs, either directly or via an intermediary Pushgateway for short-lived jobs. It stores all scraped samples locally and runs rules over this data to either aggregate and record new time series from existing data, or to generate alerts. Grafana or other API consumers can be used to visualize the collected data.
To export metrics from your application into the Cloud Platform Prometheus, see: Getting application metrics into Prometheus
AlertManager
AlertManager handles alerts sent by client applications such as the Prometheus server. It takes care of deduplicating, grouping, and routing them to the correct receiver integration such as PagerDuty. It also takes care of the silencing and inhibition of alerts.
To create and send application-specific alerts to a Slack channel see: Creating your own custom alerts
Thanos
Thanos is an open source project that is capable of integrating with a Prometheus deployment, enabling long-term, scalable storage. By adding a Thanos sidecar to Prometheus, it uploads the data every two hours to storage (an S3 bucket in our case). It also serves real-time metrics that are not uploaded to the bucket.
Thanos components including Thanos Querier, Store and Compactor have been installed in Cloud Platform monitoring stack.
Thanos Querier, which is similar to Prometheus, is able to query a Prometheus instance (through sidecar) and a Thanos Store at the same time. It allows you to query several months worth of Prometheus metrics and create Grafana dashboards based on that.
Thanos Compactor applies the compaction procedure to Prometheus block data stored in an S3 bucket. Thanos also downsampling data that are stored in the s3 bucket. For each resolutions available, the following retention periods apply:
- raw - 30 days
- 5m(five minutes) resolution - 6 months
- 1h(one hour) resolution - 1 year
Because of the downsampling of data blocks, using Grafana dashboards is not suitable for monitoring the uptime of the application for monthly/quarterly/yearly bases.
Grafana
Grafana is used to display dashboards of your metrics, typically using data from Prometheus or Thanos.
Create, explore, and share dashboards with your team and foster a data driven culture
A dashboard is defined by a ConfigMap (Kubernetes resource i.e. YAML), containing Grafana JSON, which contains one or more PromQL queries.
The JSON can be generated using the Grafana web UI. Alternatively you can copy an existing dashboard JSON, then simply adjust a few of the values.
Configure a dashboard using the Grafana UI
Although Grafana’s web UI allows you to create and edit dashboard panels, please note that changes made are not persisted - they are only temporary.
Instead, Grafana displays dashboards that are defined in ConfigMaps, which are kubernetes resources in team namespaces.
Teams can create and edit these by using kubectl, as described below. Or even better, store the ConfigMap’s YAML in a file in your repo,
and setup CI/CD to deploy it to your namespace, in a similar way to you deploy your app.
Sign in to Grafana - see the links below - with your GitHub account.
Go to the ‘Blank Dashboard’ (either using that link or search for a dashboard with that name). All users are able to edit dashboards but cannot save the changes.
Use the UI to modify the dashboard as you see fit.
To edit a panel, click/select “Panel title” and from the drop-down menu that appears, select “Edit”.
Tips:
You can see the long list of metrics available by selecting “Code” mode and then “Metrics browser”
“Data source” should normally be “Prometheus”, for querying metrics of the past 24 hours. Or if you want to query long-term metrics, select “Thanos”.
Another way to play with the query is to copy the PromQL query into the Prometheus web UI. If you have a Grafana variable such as
$namespace, which Grafana populates from a dropdown, then you will have to insert a real value when working with the query in Prometheus.When you are happy with your dashboard, to get the JSON:
- select the “gear” icon at the top, taking you to Dashboard Settings
- select “JSON Model” in the side-nav
- select the JSON and copy it to the clipboard
To save the dashboard: Save the dashboard JSON in a ConfigMap
Configure a dashboard by copying an existing one
Other teams may have just the dashboard you want, and it is often easier to copy them and adjust a few little things.
Sign in to Grafana - see the links below - with your GitHub account.
Find the dashboard you want to copy.
To get the JSON:
- select the “gear” icon at the top, taking you to Dashboard Settings
- select “JSON Model” in the side-nav
- select the JSON and copy it to the clipboard
In an editor make some adjustments. You must change:
- the “uid” needs to be unique across Cloud Platform dashboards. It should be 8+ alphanumeric characters using: [A-Za-z0-9]
- the “title” (at the top level) needs to be unique across Cloud Platform dashboards
You probably want to adjust the “Namespace” drop-down control. Dropdowns like these are under the “templating”, so you likely want to change the “regex” value that determines which namespaces are offered, and the “current” i.e. default namespace.
To save the dashboard: Save the dashboard JSON in a ConfigMap
Save the dashboard JSON in a ConfigMap
Once you have got a dashboard JSON string, paste it into a ConfigMap in your namespace:
Create a YAML file based on this one:
apiVersion: v1
kind: ConfigMap
metadata:
  name: register-my-goose-ingress-dashboard
  namespace: register-my-goose-uat
  labels:
    grafana_dashboard: ""
data:
  register-my-goose-dashboard.json: |
    {
      ...your JSON document goes here...
    }
Substitute your own values for the
name,namespace, JSON filename and the contents of the JSON document.Ensure:
- the “uid” and “title” (at the top level) are unique amongst Cloud Platform dashboards. (If you create a ConfigMap with values that duplicate any other in Cloud Platform, then until this is resolved, Grafana will NOT apply changes to ANY dashboards! Issue is described here: Grafana #39467)
- the filename must be unique amongst Cloud Platform dashboards (otherwise you’ll see “Dashboard not found” errors)
- the filename must end in
-dashboard.json - the JSON string must be properly indented
Note: you can have multiple dashboards exported in a single
ConfigMapas wellUse
kubectlto apply theConfigMapabove, and your dashboard should be visible in Grafana within about a minute.
Tips
These dashboards are infrastructure, so as with other infrastructure as code it’s a good idea to store the YAML as a file in your app’s git repo, and set-up CI/CD to deploy changes to the ConfigMap. This allows changes to be PR-reviewed by team mates, and changes to be tracked, reverted, and deployment is easier.
Cloudwatch metrics can be shown in a dashboard - see: Using the CloudWatch data source in Grafana
Metrics over a longer term than 24h can be shown. To build dashboards for long-term metrics, select “Thanos” as the “Data source”.
Pushgateway
Pushgateway allows ephemeral and batch jobs to expose their metrics to Prometheus. Since these kinds of jobs may not exist long enough to be scraped, they can instead push their metrics to a Pushgateway. The Pushgateway then exposes these metrics to Prometheus.
You can install pushgateway into your namespace by adding the module to your resources folder of cloud-platform-environments repo.
How to access monitoring tools
All links provided below require you to authenticate with your Github account.
Prometheus: https://prometheus.cloud-platform.service.justice.gov.uk
Thanos: https://thanos.live.cloud-platform.service.justice.gov.uk
AlertManager: https://alertmanager.cloud-platform.service.justice.gov.uk
Grafana: https://grafana.cloud-platform.service.justice.gov.uk
Other monitoring tools
Sentry isn’t supported by the Cloud Platform team, but it is a useful tool for monitoring errors in your application.
Validate Prometheus Rule
PrometheusRule can be validated using a Linter in a github action, for more on how to do this follow the below link:
Further documentation
Prometheus Overview and Architecture