Getting application metrics into Prometheus
Overview
This guide will walk you through the steps to export metrics from your application into the Cloud Platform Prometheus. By exporting these metrics into Prometheus, you can create useful observability tools like Grafana dashboards and triggered alerts on things like crashing pods and failed deployments. To do that, Prometheus needs to be able to scrape data from a /metrics endpoint, which is created by a Prometheus client library. Once you have a /metrics endpoint, you can create a ServiceMonitor to connect the Cloud Platform Prometheus to your endpoint and store data for querying.
The example application in this document will be the Ruby reference app, utilising the Ruby prometheus-client gem. If you’re following along in another language, Prometheus offers several client libraries to get you started. At the end, you should have a working /metrics endpoint that displays your site’s response time, which we can use to query the application latency in the Cloud Platform Prometheus.
The application latency metric is quite basic, but our intention is to get you started.
Assumptions
To keep this document short, we will assume you already have an application up and running in a namespace on the Cloud Platform, if not, please see Deploying an example application to the Cloud Platform.
Note: make sure your container has the correct timezone see see here
Changing the application code
We need to add the Prometheus Ruby client library via a gem to give us our /metrics endpoint.
First, add the gem to your Gemfile and install with bundler.
gem 'prometheus-client'
Next, we need to amend the config.ru file and include the two rack middlewares required by the prometheus-client.
require_relative 'config/environment'
require 'prometheus/middleware/collector'
require 'prometheus/middleware/exporter'

use Prometheus::Middleware::Collector
use Prometheus::Middleware::Exporter

run Rails.application
If you’re running this locally, you’ll now be able to query your /metrics endpoint and see some metrics data. If nothing appears, or metrics cannot be found, this hasn’t worked.
curl localhost:3000/metrics
Build, tag and push your application changes to your code repository and deploy the latest version into your Cloud Platform namespace. Confirm your /metrics endpoint is now accessible from your url.
curl https://myapp.cloud-platform/metrics
Add Service endpoint and ServiceMonitor
We need to expose the metrics endpoint with a Service and tell the Cloud Platform Prometheus to scrape the endpoint with a ServiceMonitor object in Kubernetes. A ServiceMonitor is a custom resource definition (CRD) that allows you to automatically generate Prometheus scrape configuration based on a specified resource.
In this example, we’re using the same port to expose both our application and metrics endpoint, so we’ll need to query our existing Service for the current port name. However, if you’re exposing a different port, you’ll need to either amend your current Service or create a new one.
Let’s find what our current port name and number are by running:
kubectl -n <namespace> get svc rails-app-service -o=jsonpath={.spec.ports[0].name}
As you can see, the name of the port we’re exposing is http.
If the above syntax fails with the following:
#: no matches found: -o=jsonpath={.spec.ports[0].name}
You most likely have multiple ports set in your Service you’ll need to run the following command:
kubectl -n <namespace> get svc rails-app-service -o jsonpath='{range .spec}{"Name: "}{.ports[*].name}{"\nPort: "}{@.ports[*].port}{"\n"}{end}'
Create and apply your service monitor <application>-serviceMonitor.yaml, as below:
   apiVersion: monitoring.coreos.com/v1
   kind: ServiceMonitor
   metadata:
     name: rails-app-service
   spec:
     selector:
       matchLabels:
         app: rails-app-service # this needs to match the label in the service under metadata:labels:app
     endpoints:
     - port: http # this is the port name you grabbed from your running service
       interval: 15s
This will tell Prometheus to go and scrape that endpoint every 15 seconds and store any exposed metrics.
Add a NetworkPolicy resource
The Prometheus server is in the ‘monitoring’ namespace, but by default, any network connections from outside your application’s namespace will be blocked. So, to allow prometheus to scrape your application’s /metrics endpoint, we need to add a network policy to allow connections from the monitoring namespace.
Create and apply a new resource <application>-networkPolicy.yaml, as below:
   kind: NetworkPolicy
   apiVersion: networking.k8s.io/v1
   metadata:
     name: allow-prometheus-scraping
     namespace: my-app-namespace
   spec:
     podSelector:
       matchLabels:
         app: rails-app
     policyTypes:
     - Ingress
     ingress:
     - from:
       - namespaceSelector:
           matchLabels:
             component: monitoring
Querying metrics
We can now query our /metrics endpoint using the Cloud Platform Prometheus.
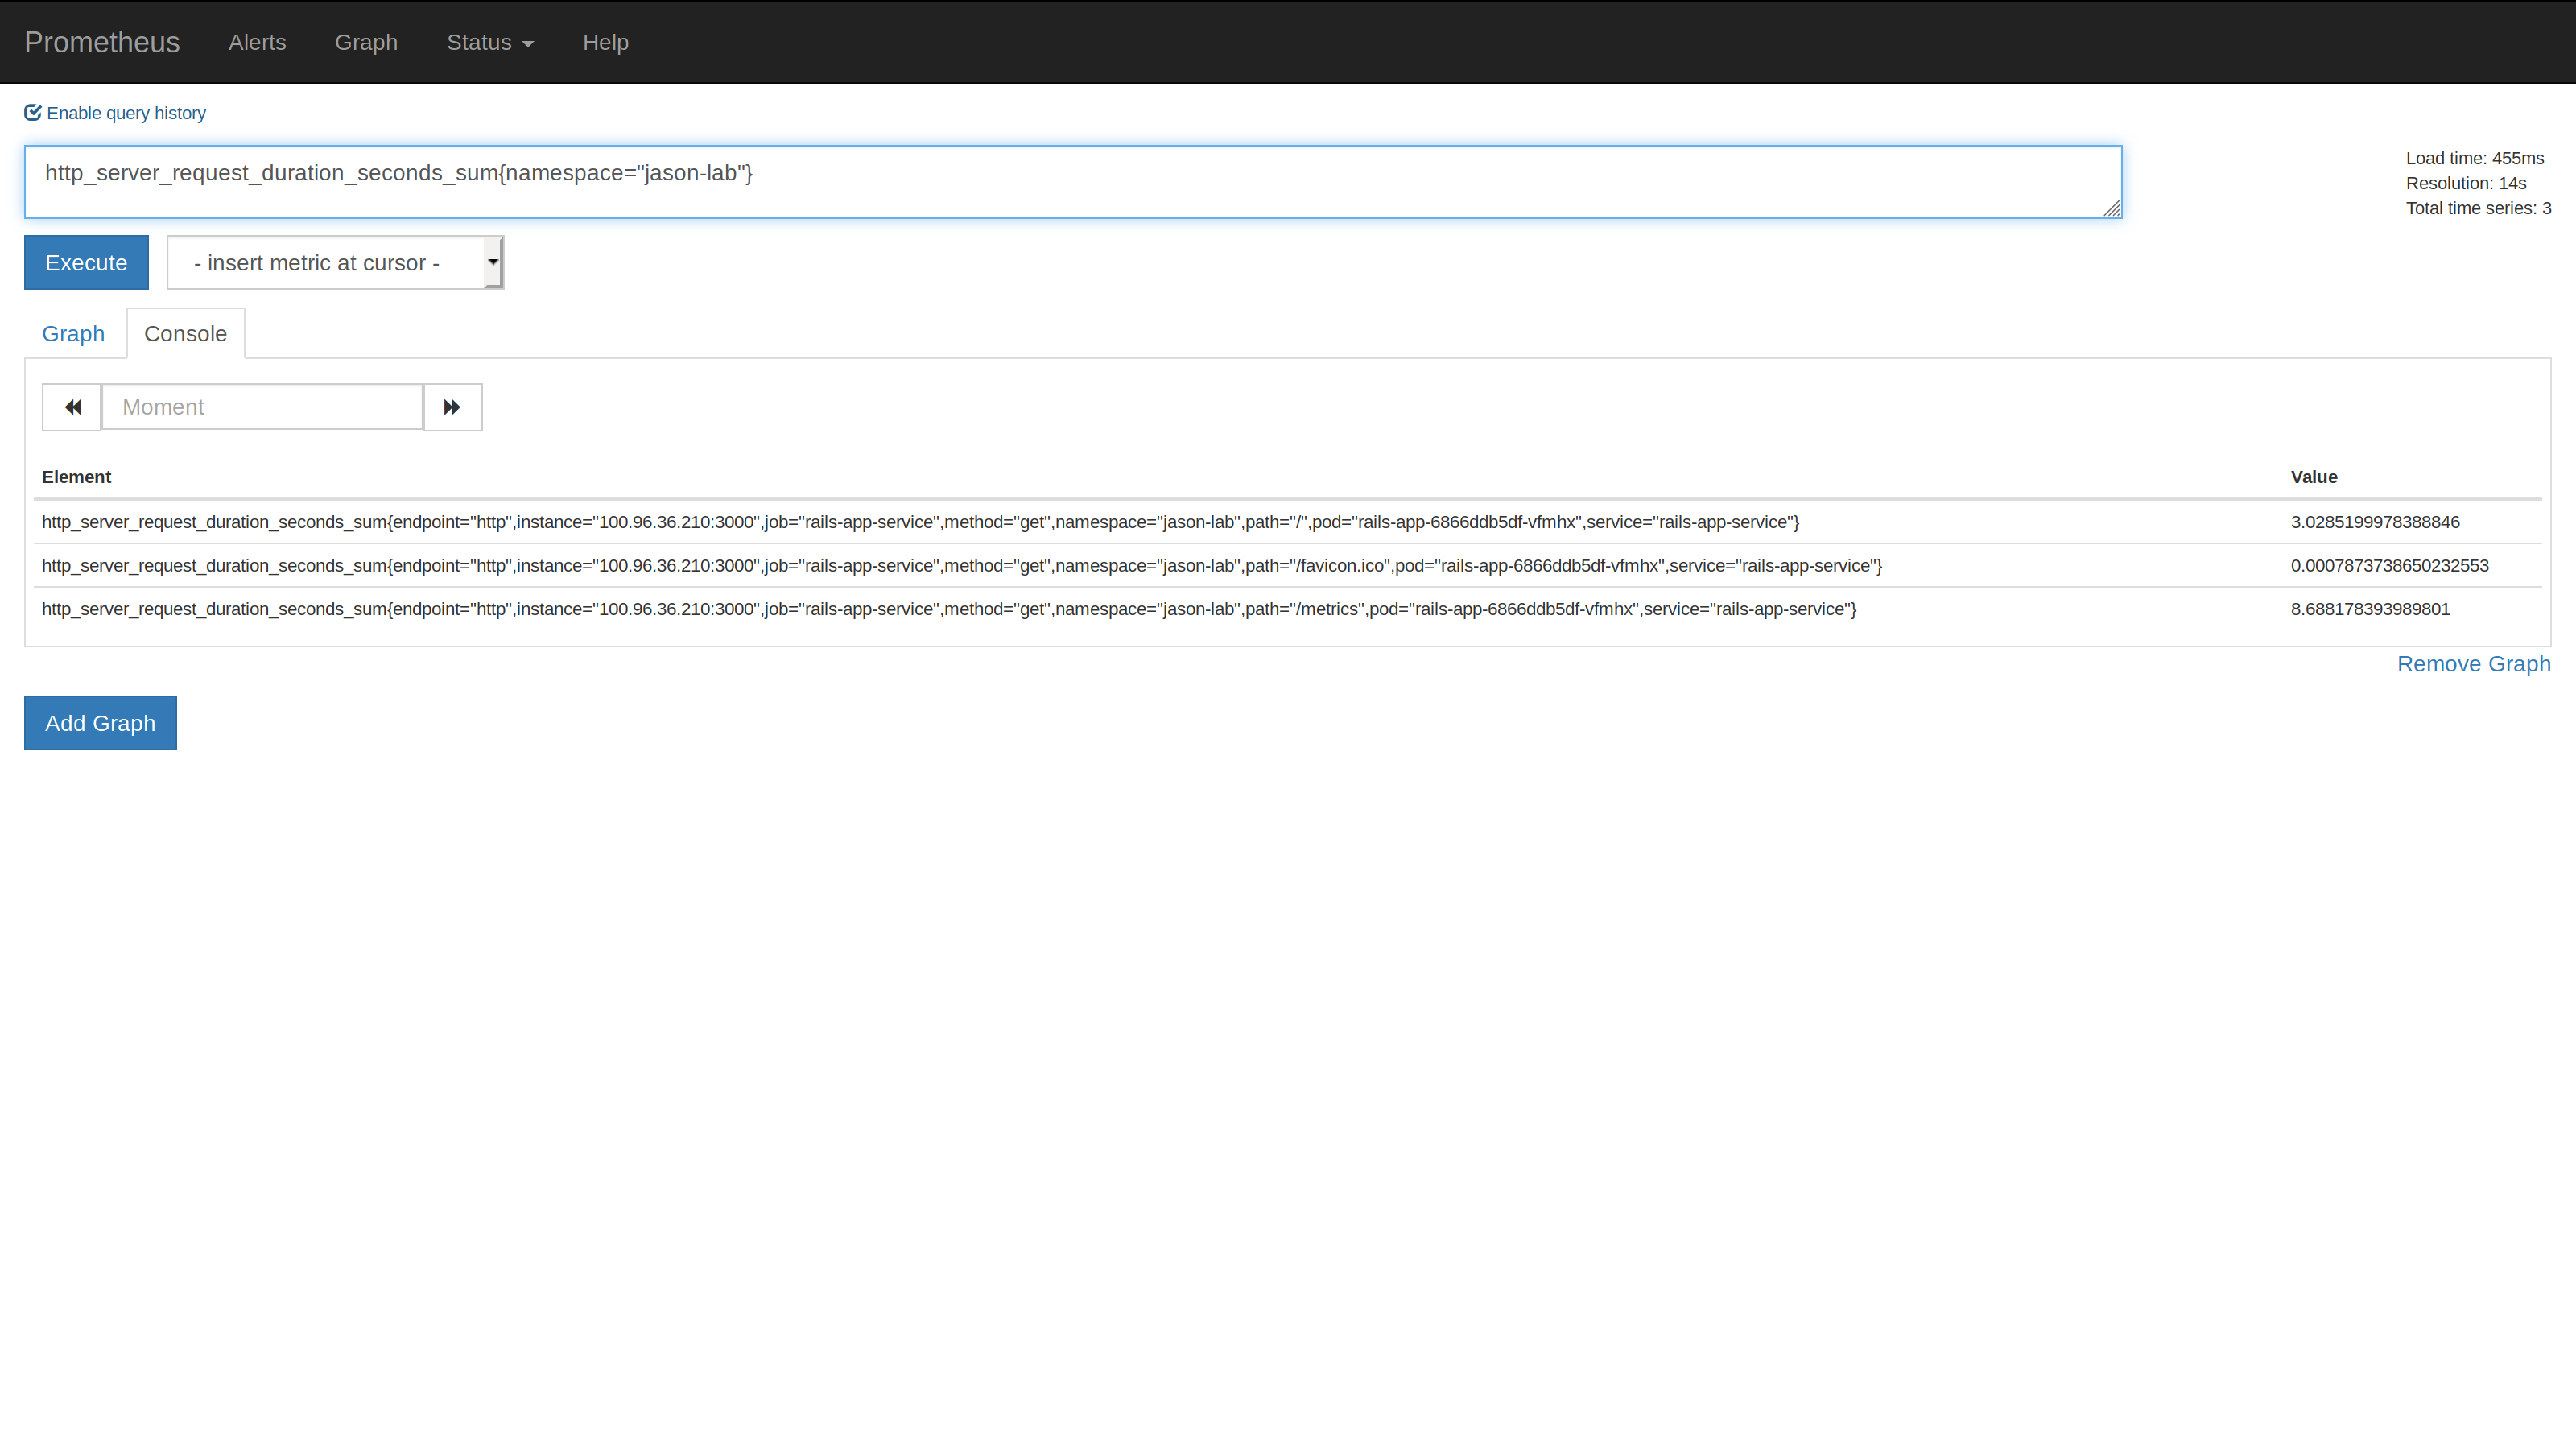
Head to the Cloud Platform’s instance of Prometheus and use the following promql query to view the application latency (remembering to change the namespace value):
http_request_duration_seconds_sum{namespace="my-namespace"}
The output will be something like:
Example in full
If you’d like to see the changes I’ve made to the cloud-platform-multi-container-demo-app, please see this PR.
Applications configured to use multiple processes
If you’re using a pre-forking web server (like unicorn or puma for Ruby, or gunicorn for Python) and have it configured to use multiple processes, then you need to use a Prometheus client library that supports exporting metrics from multiple processes. Not all the official clients do that. If you don’t use a library which supports this, then requests to /metrics could be served by any of the processes, which would mean Prometheus sees inconsistent data on each scrape. The prometheus-client library we used in the example above supports multi-process metrics so will need to be aggregated, to report coherent total numbers. For more information on this please read this article.
More information on Service Monitors
CoreOS README on Custom Resource Definitions