Using the CloudWatch data source in Grafana
Introduction
To build dashboards for your CloudWatch metrics, you can use the CloudWatch data source.
Using the CloudWatch data source in Grafana
There are some default dashboards here, or you can build your own. You can also do dynamic queries using dimension wildcards.
Create a dashboard using CloudWatch data source:
From the official & community built dashboards, select the AWS resource for which you want to create the dashboard. Download it as JSON and modify it as you see fit. Copy the JSON string into a ConfigMap according to the example below.
---
apiVersion: v1
kind: ConfigMap
metadata:
  name: <my-dashboard>
  namespace: <my-namespace>
  labels:
    grafana_dashboard: ""
data:
  my-dashboard.json: |
    {
      [ ... ]
    }
Add the ConfigMap above to your namespace folder in the environments repo. Once the ConfigMap is applied though the Apply Pipeline, your dashboard should be visible in Grafana shortly.
Dynamic queries using dimension wildcards:
Login to Grafana with your GitHub account. Select CloudWatch in Explore as shown in the picture below
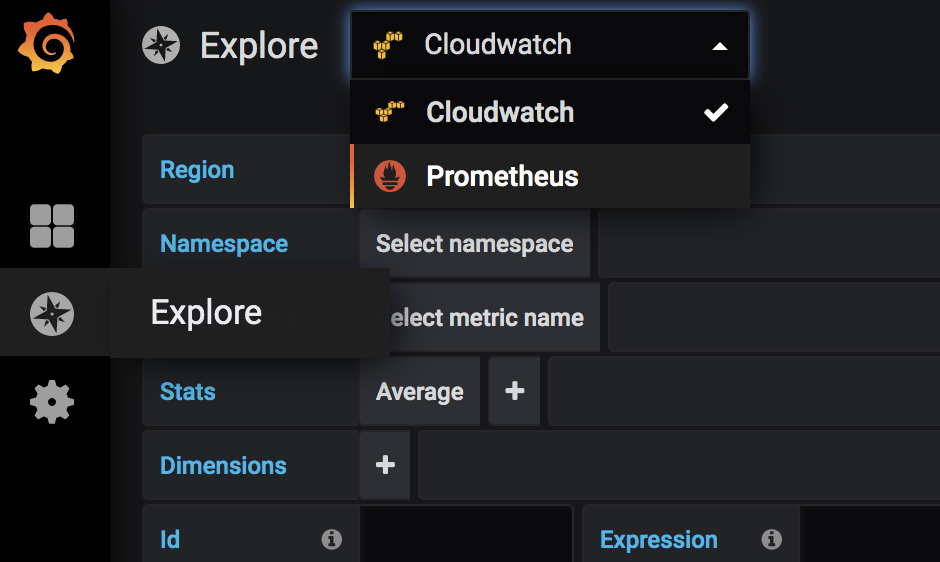
Follow the guidance here, to do dynamic queries using dimension wildcards.