Creating Monitor Alert in OpenSearch
Overview
This guide will walk you through the steps on how to create an OpenSearch monitor alert in Cloud Platform OpenSearch Cluster with our terraform cloud-platform-terraform-opensearch-alert module.
OpenSearch monitor alerts allow you to detect specific conditions within your OpenSearch data and send notifications to a Slack channel.
Prerequisites
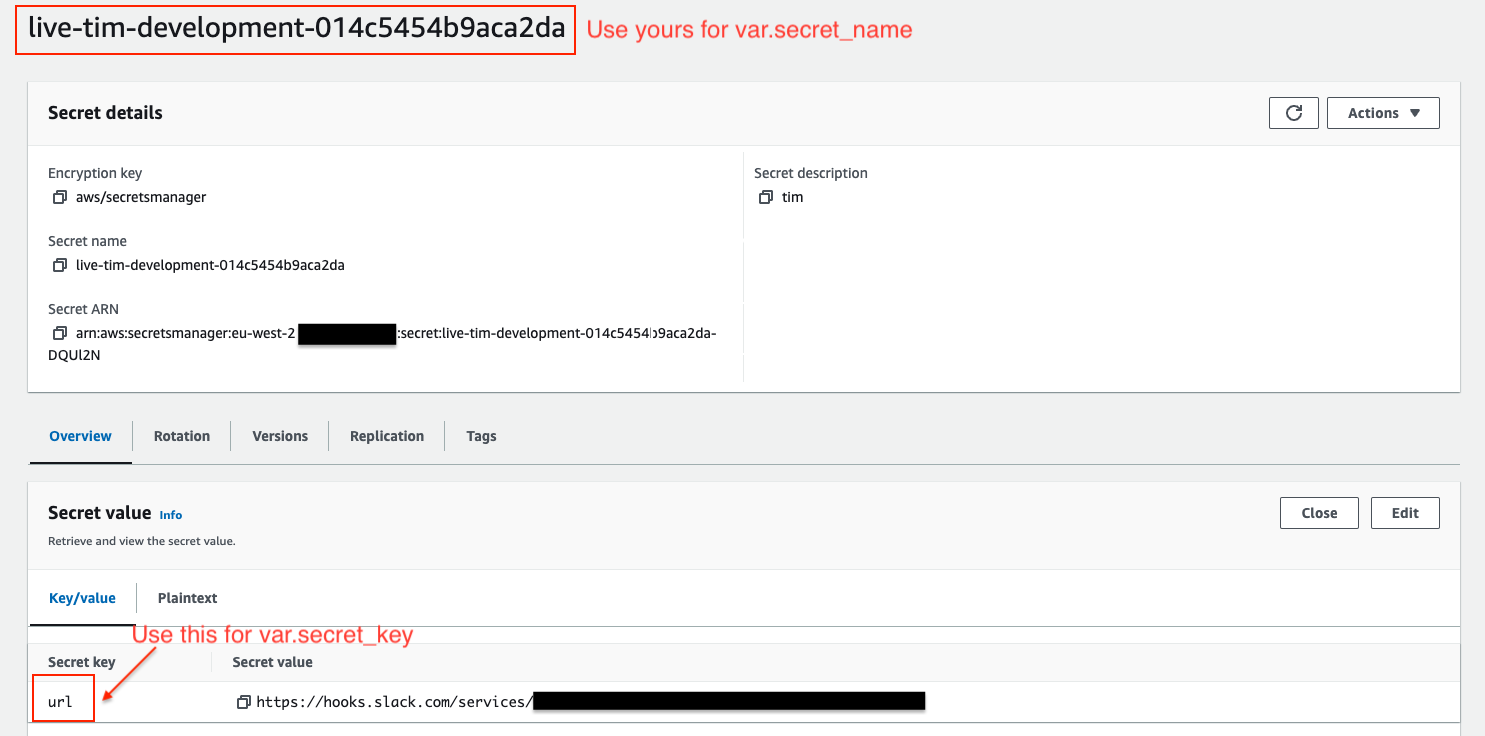
Before creating OpenSearch monitor alert, you need to use cloud-platform-terraform-secrets-manager module to create secret in AWS Secrets Manager to store the Slack webhook URL.
After merging PR, login to the AWS console, search for Secrets Manager and navigate to the secret created in the previous step.
Click on the secret and then click on Retrieve secret value. If this is your first time accessing the new secret, you will see an error Failed to get the secret value:
This is expected, since we haven’t added a value just yet!
Next, click on Set secret value.
Set the secret key to your desired key (e.g url) and the secret value to the actual Slack webhook URL.
Cliek on “Save”.
Once the Slack webhook URL is stored, you can reference the variable secret_name and the secret_key in the OpenSearch alert module.
You may refer to our user guide secret section for more information.
Creating an OpenSearch Monitor Alert in Application Log OpenSearch Cluster
Once you have stored your Slack URL using the cloud-platform-terraform-secrets-manager, you can proceed to create an OpenSearch monitor alert with cloud-platform-terraform-opensearch-alert module.
By default, this module will create an alert in Cloud Platform Application Log OpenSearch.
Setup Terraform Module for OpenSearch Alerts:
Add the following configuration to your Terraform files to create an OpenSearch monitor alert. This Terraform module will detect specific conditions and send notifications to a Slack channel.
module "opensearch_alert" {
    source = "github.com/ministryofjustice/cloud-platform-terraform-opensearch-alerts?ref=1.0.0" #use the latest version

    secret_name                    = "secret-name-created-by-secret-manager-module"
    secret_key                     = "url"
    environment_name               = var.environment
    slack_channel_name             = "your-slack-channel-name"
    slack_channel_name_description = "slack-channel-description"
    opensearch_alert_name          = "example-opensearch-alert-name"
    opensearch_alert_enabled       = true
    monitor_period_interval        = "1"
    monitor_period_unit            = "MINUTES"
    alert_query                    = jsonencode(
      {
        Your_alert_query : query
      }
    )
    trigger_name                   = "example-trigger-name"
    serverity                      = "1"
    query_source                   = "ctx.results[0].hits.total.value > 1"
    action_name                    = "trigger-action-name"
    slack_message_subject          = "slack-message-subject"
    slack_message_template         = "Monitor {{ctx.monitor.name}} just entered alert status. Please investigate the issue.\n- Trigger: {{ctx.trigger.name}}\n- Severity: {{ctx.trigger.severity}}"
    alert_throttle_enabled         = true
    throttle_value                 = 60
    throttle_unit                  = "MINUTES"
  }
Once the PR is merged and applied, the following resources will be created:
OpenSearch configuration Slack Channel for Notification
OpenSearch Monitor
If you would like to create additional monitor alerts, you can recall the module with different configurations.
Alert Monitor Query
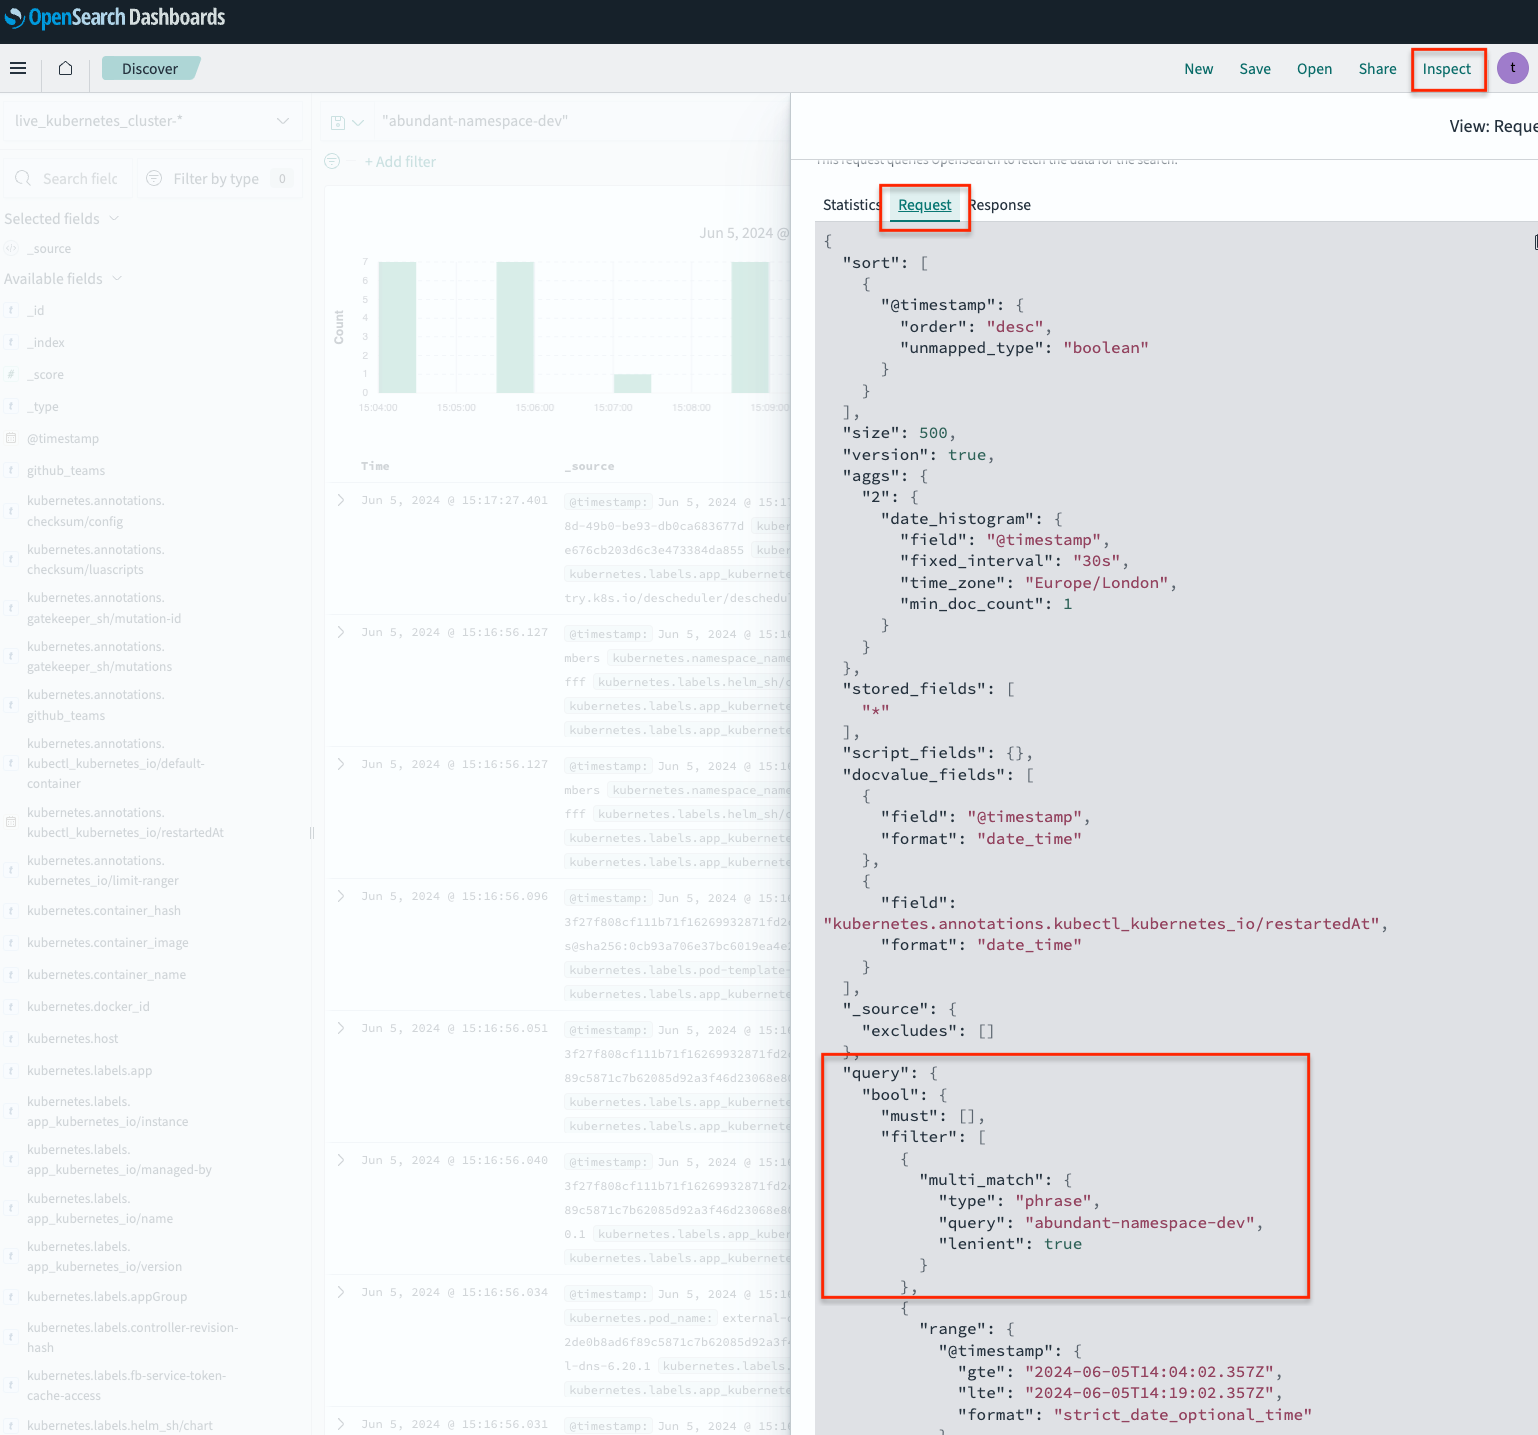
If you are creating new alert monitor have no idea how to fill the alert query, you may go to OpenSearch dashboard and make your query search with OpenSearch query DSL.
After that, you may click Inspect - Request to have the query in JSON format.
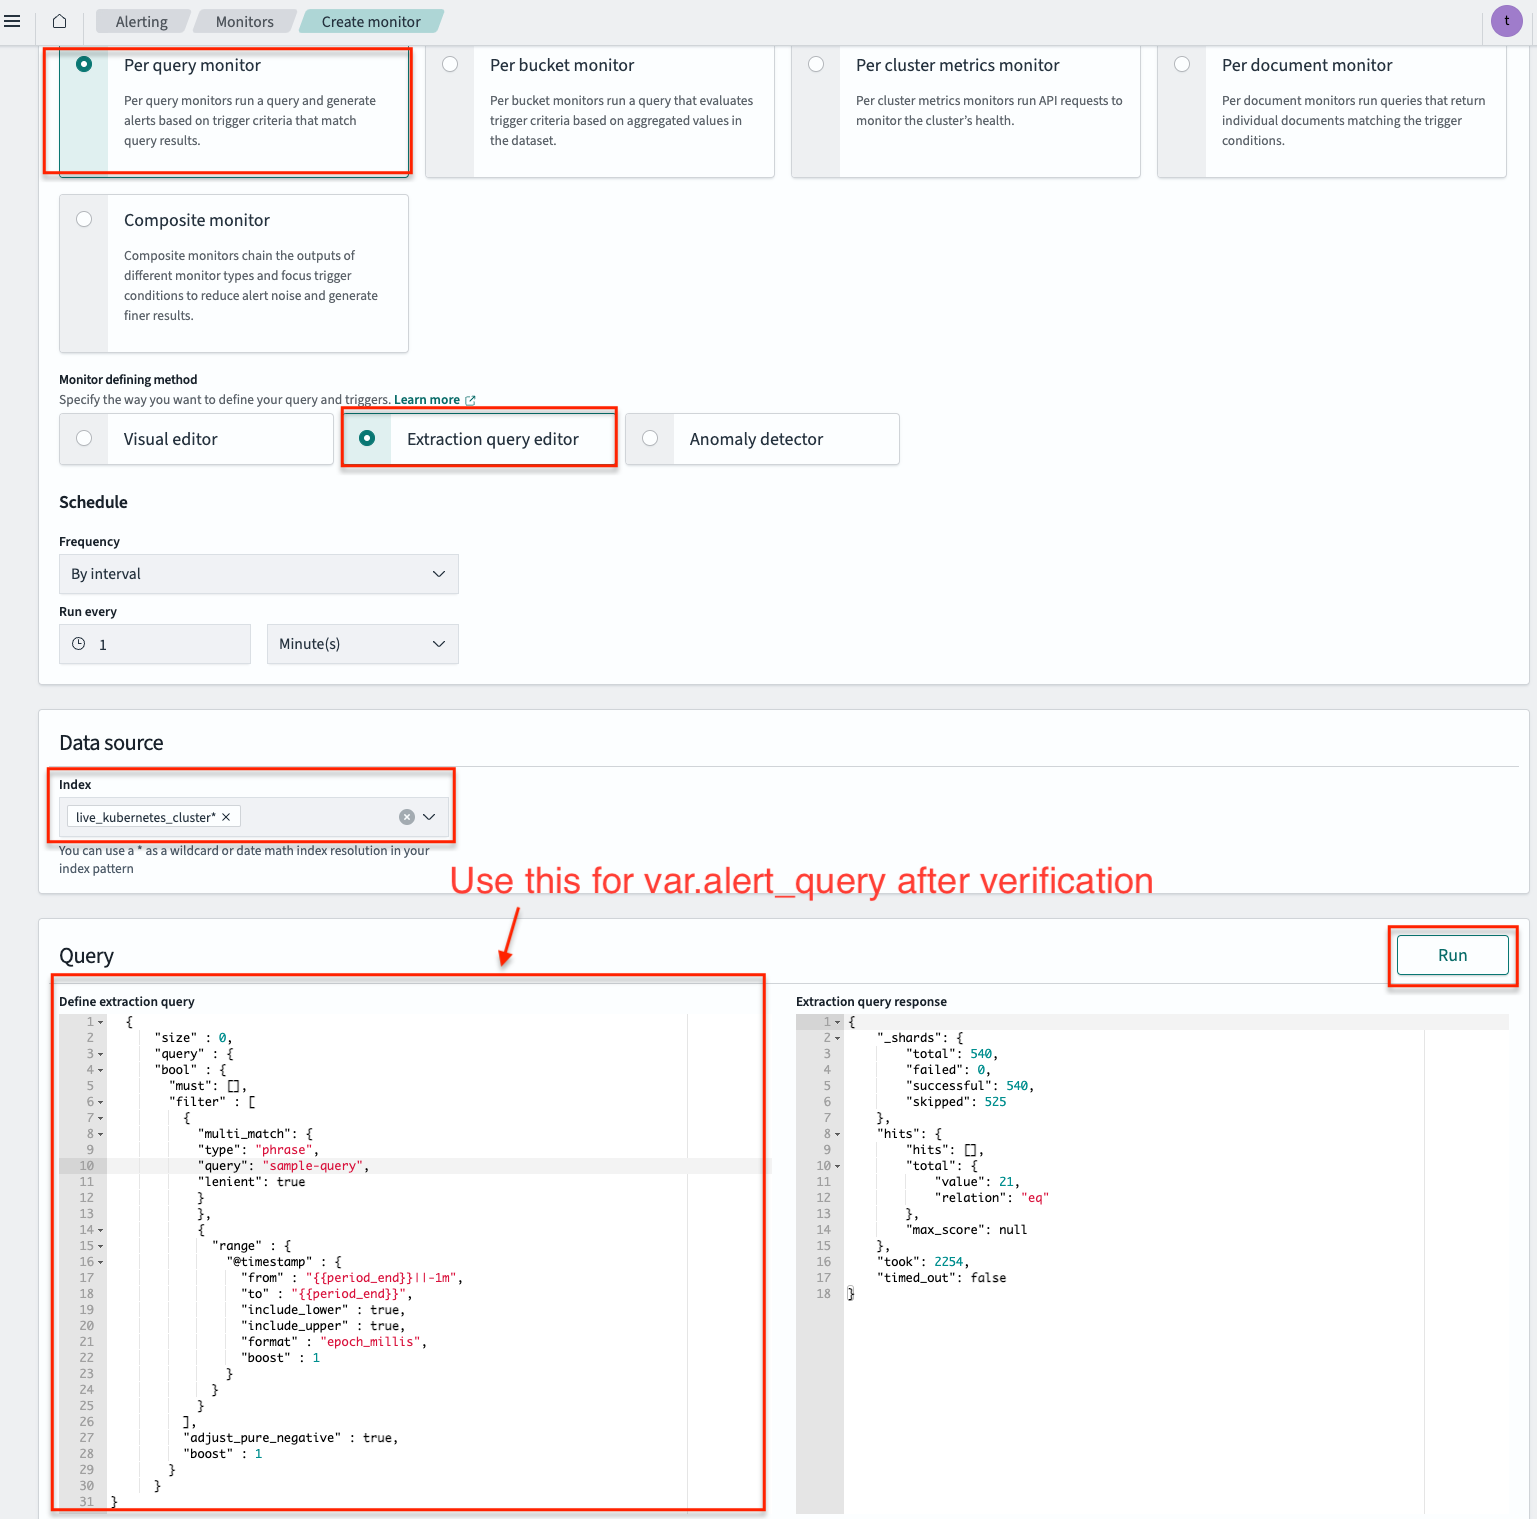
To verify a query, you can go to Alerting - Monitors and Click Create Monitor.
Under Monitor defining method, choose Extraction query editor, fill in live_kubernetes_cluster* for data source index.
Add your query (using OpenSearch query DSL), and test it using the Run button. You can use Extraction query response to test and verify your query.
After that, you can just copy and paste the Query to the cloud-platform-terraform-opensearch-alert module variable alert_query.
Migrating from ElasticSearch to OpenSearch
The Cloud Platform ElasticSearch platform has now been migrated to OpenSearch. If you have existing ElasticSearch alerts, please contact the Cloud Platform team for support.
Creating alert in Cloud Platform Modsec Audit logs OpenSearch Cluster
If you want to create an alert in Cloud PlatformModsec Audit logs Opensearch, you can add the variable below when calling the module:
var.aws_opensearch_domain = "cp-live-modsec-audit"
var.aws_iam_role          = "opensearch-access-role"
var.index                 = ["live_k8s_modsec*", "live_k8s_modsec_ingress*"]
The module will look like below
module "opensearch_alert_modsec" {
    source = "github.com/ministryofjustice/cloud-platform-terraform-opensearch-alerts?ref=1.0.0" #use the latest version

    var.aws_opensearch_domain      = "cp-live-modsec-audit"
    var.aws_iam_role               = "opensearch-access-role"
    var.index                      = ["live_k8s_modsec*", "live_k8s_modsec_ingress*"]

    secret_name                    = "secret-name-created-by-secret-manager-module"
    secret_key                     = "url"
    environment_name               = var.environment
    slack_channel_name             = "your-slack-channel-name"
    slack_channel_name_description = "slack-channel-description"
    opensearch_alert_name          = "example-opensearch-alert-name"
    opensearch_alert_enabled       = true
    monitor_period_interval        = "1"
    monitor_period_unit            = "MINUTES"
    alert_query                    = jsonencode(
      {
        Your_alert_query : query
      }
    )
    trigger_name                   = "example-trigger-name"
    serverity                      = "1"
    query_source                   = "ctx.results[0].hits.total.value > 1"
    action_name                    = "trigger-action-name"
    slack_message_subject          = "slack-message-subject"
    slack_message_template         = "Monitor {{ctx.monitor.name}} just entered alert status. Please investigate the issue.\n- Trigger: {{ctx.trigger.name}}\n- Severity: {{ctx.trigger.severity}}"
    alert_throttle_enabled         = true
    throttle_value                 = 60
    throttle_unit                  = "MINUTES"
  }
More in-depth guides on using OpenSearch can be found below:
- Introduction to OpenSearch Alerting
- OpenSearch Per query and per bucket monitors
- OpenSearch Dashboards Query Language (DQL)


