How Cloud Platform Meet the Service Standard
Overview
The Ministry of Justice (MoJ) has embraced cloud technology to revolutionise how digital services are hosted, managed, and delivered. The MoJ’s Cloud Platform offers a cloud-native hosting platform environment designed to meet the dynamic needs of modern digital services. Leveraging the power and flexibility of Public Cloud and Cloud native features, the platform ensures that services are reliable, secure, and scalable.
How Cloud Platform Supports Service Standard Compliance
Public Cloud: The Backbone of the Cloud Platform
Part of the core foundation of MoJ’s Cloud Platform is Public Cloud - AWS. This collaboration brings:
Scalability: AWS’s vast infrastructure allows the Cloud Platform to scale services seamlessly in response to demand.
Security: AWS’s comprehensive security features, coupled with the Cloud Platform’s governance, ensure that data and services are protected in line with the highest standards.
Innovation: Access to AWS’s wide array of services enables the MoJ to innovate and deploy cutting-edge technologies, enhancing service delivery.
Cloud-Native by Design
The Cloud Platform is cloud-native from the ground up, designed to harness the benefits of containerization, microservices, and continuous deployment. This approach ensures:
Flexibility: Services can be updated and scaled without downtime, promoting agility and continuous improvement.
Resilience: Cloud-native principles, such as fault tolerance and redundancy, are inherent, ensuring services remain available even under challenging conditions.
Efficiency: The platform optimises resource use, reducing costs and environmental impact.
Kubernetes on AWS EKS: Benefits for Service Standard Compliance
Cloud Platform Team has adopted Amazon Elastic Kubernetes Service (EKS) for running the live and manager clusters, which host MOJ service teams’ applications and run infrastructure CI/CD. EKS enhances the power of Kubernetes by providing a managed environment that simplifies deployment, management, and scaling of containerized applications.
Simplified Kubernetes Management
- Managed Control Plane: AWS EKS automates tasks such as patching, node provisioning, and updates. This managed service model allows teams to concentrate on application development by reducing the operational overhead of running Kubernetes, directly supporting the Service Standard’s focus on efficiency and user value.
Enhanced Security and Compliance
IAM Integration for Fine-Grained Access Control: EKS integrates with AWS Identity and Access Management (IAM), providing granular security control over access to the Kubernetes API, enhancing security and compliance with the Service Standard.
Network Policies with Amazon VPC: Utilise Amazon VPC to create isolated network environments for Kubernetes clusters, offering enhanced security through network policies. This setup ensures secure communication between pods and external services, aligning with the Service Standard’s requirements for secure data handling and privacy.
High Availability and Scalability
Multi-AZ Deployments for High Availability: EKS runs the Kubernetes control plane across multiple Availability Zones, reducing the risk of downtime and ensuring high availability of services, which is crucial for meeting the Service Standard’s reliability criteria.
Automatic Scaling: Leverage Kubernetes Horizontal Pod Autoscaler on EKS to automatically adjust the number of pods in response to demand. Additionally, EKS supports Cluster Autoscaler to optimise the number of nodes in the cluster, ensuring efficient resource use and responsiveness.
Zero Downtime Deployments
- Rolling Updates and Canary Deployments: Kubernetes’ rolling updates feature, facilitated by EKS, allows for seamless application updates without downtime. Canary deployments can be implemented to test new versions in production with minimal impact, ensuring continuous service delivery in line with the Service Standard.
Observability and Monitoring
- Integration with CloudWatch and Prometheus: AWS EKS clusters can be monitored using Amazon CloudWatch, which provides detailed visibility into container and cluster performance. Integration with Prometheus offers comprehensive metrics collection and alerting, supporting proactive issue resolution and system optimization.
Self-Healing and Automated Recovery
- Kubernetes Self-Healing Capabilities: Kubernetes’ ability to automatically replace failed containers and reschedule workloads on healthy nodes is enhanced by EKS’s monitoring and management features. This ensures resilience and reliability, essential aspects of the Service Standard.
Security and Compliance
Secrets Management: Kubernetes allows you to manage sensitive information (like passwords, OAuth tokens, and SSH keys) using Secrets, keeping this data secure both in transit and at rest.
Network Policies: Define how groups of pods can communicate with each other and other network endpoints. Kubernetes’ network policies are essential for creating secure microservice architectures.
Role-Based Access Control (RBAC): Kubernetes supports RBAC, allowing you to regulate access to resources based on the roles of individual users within your organization. This facilitates compliance with the least privilege principle, enhancing security.
IAM Roles for Service Accounts (IRSA) Access Control: EKS supports associating IAM roles with Kubernetes service accounts. This feature allows you to assign specific AWS permissions to the pods running in EKS, following the principle of least privilege. It significantly enhances security by ensuring that applications have only the permissions they need to operate, reducing the potential impact of a security breach.
Data Encryption: AWS EKS integrates with AWS Key Management Service (KMS) to offer encryption for data stored in etcd, the Kubernetes backing store. This includes secrets and other sensitive data, ensuring that data at rest is protected in accordance with compliance and regulatory requirements.
Network Security: EKS clusters are deployed within an Amazon Virtual Private Cloud (VPC), allowing you to leverage VPC security features such as security groups. This integration provides strong network isolation capabilities, preventing unauthorized access and ensuring that traffic between pods and external services is securely managed.
Infrastructure as Code: Core to Cloud Platform Operations
The Cloud Platform team adopts a rigorous Infrastructure as Code (IaC) methodology, central to managing the platform’s infrastructure and ensuring that every change is meticulously documented, reviewed, and version-controlled. This approach underpins our commitment to reliability, security, and compliance, aligning with the principles of the Service Standard.
Concourse CI/CD and GitHub Integration
Automated Deployments: Utilizing Concourse CI/CD, we automate the deployment of AWS resources. This automation extends to our IaC practices, ensuring that infrastructure provisioning and updates are executed precisely and consistently.
Code Storage and Management: All infrastructure code is stored on MoJ GitHub, with the cloud-platform-infrastructure repository serving as the main hub where the infrastructure is defined and integrated. This central repository contains Terraform modules for various components, each managed in their own dedicated Git repository.
Infrastructure as Code Methodology
Terraform for Infrastructure Management: Our platform leverages Terraform, a leading IaC tool, to define and deploy the AWS resources. Terraform modules allow for reusable, modular infrastructure components, enhancing efficiency and maintainability.
Modular Repository Structure: By maintaining Terraform modules in separate repositories, we ensure modularity and scalability of our infrastructure code. This structure facilitates focused development and versioning of each component.
Environment Management and Automation
- Source of Truth: The cloud-platform-environments repository acts as the source of truth for team environments, specifically Kubernetes namespaces. This repository tracks and manages the configurations and deployments within our Kubernetes clusters.
PR-Based Workflow for Changes
Change Proposal: Team members propose changes by creating Pull Requests (PRs) against the cloud-platform-environments repository.
Plan Pipeline Verification: The proposed changes are automatically verified through a ‘plan’ pipeline in Concourse CI/CD, providing a preview of the impact of the changes.
Peer Review and Approval: Before merging, PRs require approval from a team member, ensuring that changes are reviewed and validated.
Automatic Application: Upon PR merge, an ‘apply’ pipeline automatically deploys the changes to the respective environments, streamlining the update process.
End-to-End Automation: The environments repository benefits from a fully automated process, from change proposal to deployment. This automation ensures that environments are updated in a controlled, traceable, and efficient manner, minimizing manual errors and accelerating deployment cycles.
Automated Testing and Validation
Go Infrastructure Tests
Automated infrastructure tests ensure that the underlying platform remains stable and secure, reducing the risk of downtime or security vulnerabilities that could impact service delivery.
OPA Gatekeeper Tests
With Open Policy Agent (OPA) Gatekeeper integration, the Cloud Platform enforces compliance and governance policies automatically. This ensures that all deployed services adhere to organizational and regulatory standards, aligning with the Service Standard’s focus on security and data protection.
Terraform Module Tests
Terraform module tests validate the infrastructure as code (IaC) components, ensuring that the provisioning and management of resources are performed consistently and correctly across all environments. This supports the Service Standard’s requirements for a technically robust infrastructure.
Isolated Testing Environments
Multiple Environments Support
The Cloud Platform facilitates the use of multiple, isolated environments, including clusters and namespaces. This allows teams to test applications and configurations in environments that closely mirror production, identifying any hosting or configuration issues early in the development cycle.
Regular IT Health Checks
Performing regular internal IT health checks ensures that the platform and the services running on it remain optimized for performance, security, and reliability. This proactive approach supports the Service Standard’s emphasis on continuous improvement and user satisfaction.
NCSC Review
The platform’s security posture and practices have been reviewed by the National Cyber Security Centre (NCSC), providing an additional layer of assurance that the Cloud Platform is designed with security at its core.
Comprehensive Cloud Platform Monitoring and Alerting
The Cloud Platform employs a sophisticated monitoring and alerting stack to ensure services are performant, reliable, and secure.
Below is the high level architecture:
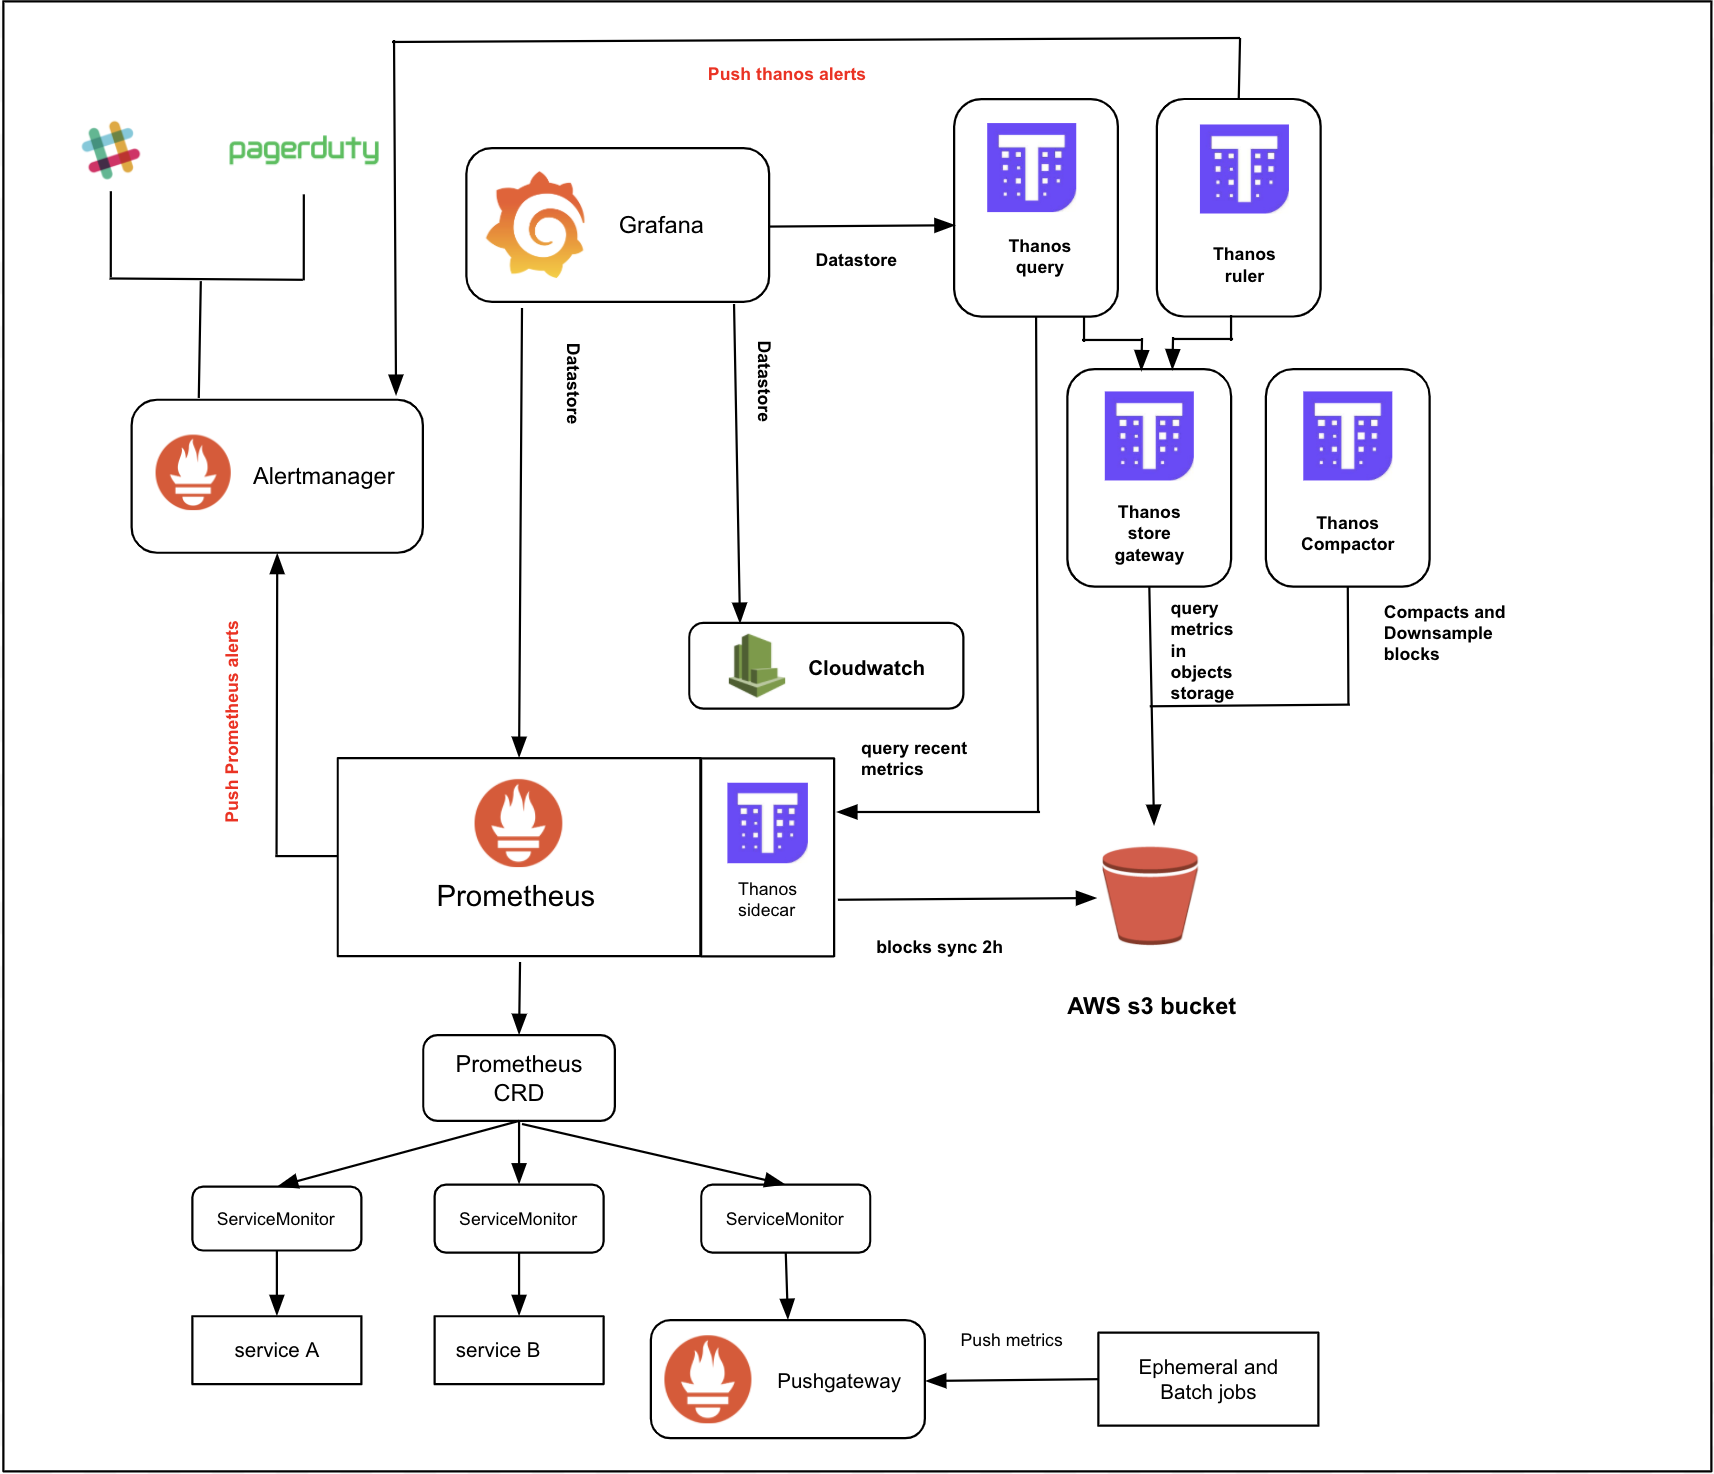
Prometheus
Prometheus is an open-source systems monitoring and alerting toolkit originally built at SoundCloud. The Cloud Platform uses Prometheus Operator from CoreOS which allows a number of Prometheus instances to be installed on a cluster (although we currently use a single Prometheus instance for the whole cluster).
Prometheus is at the heart of the monitoring system, gathering metrics from configured targets at specified intervals, evaluating rule expressions, and generating alerts based on these metrics.
Prometheus scrapes metrics from instrumented jobs, either directly or via an intermediary Pushgateway for short-lived jobs. It stores all scraped samples locally and runs rules over this data to either aggregate and record new time series from existing data, or to generate alerts. Grafana or other API consumers can be used to visualize the collected data.
AlertManager
AlertManager handles alerts sent by client applications such as the Prometheus server. It takes care of deduplicating, grouping, and routing them to the correct receiver integration such as PagerDuty. It also takes care of the silencing and inhibition of alerts.
Grafana
Grafana provides rich visualizations of the data collected by Prometheus. Its customizable dashboards allow teams to monitor their services in real-time, with the ability to drill down into metrics for detailed analysis.
Grafana is used to display dashboards of the metrics, typically using data from Prometheus or Thanos.
A dashboard is defined by a ConfigMap (Kubernetes resource i.e. YAML), containing Grafana JSON, which contains one or more PromQL queries.
Thanos
Thanos is an open source project that is capable of integrating with a Prometheus deployment, enabling long-term, scalable storage. By adding a Thanos sidecar to Prometheus, it uploads the data every two hours to storage (an S3 bucket in our case). It also serves real-time metrics that are not uploaded to the bucket.
Thanos components including Thanos Querier, Store and Compactor have been installed in Cloud Platform monitoring stack.
Thanos Querier, which is similar to Prometheus, is able to query a Prometheus instance (through sidecar) and a Thanos Store at the same time. It allows you to query several months worth of Prometheus metrics and create Grafana dashboards based on that.
Thanos Compactor applies the compaction procedure to Prometheus block data stored in an S3 bucket. Thanos also downsampling data that are stored in the s3 bucket. For each resolutions available, the following retention periods apply:
- raw - 30 days
- 5m(five minutes) resolution - 6 months
- 1h(one hour) resolution - 1 year
Because of the downsampling of data blocks, using Grafana dashboards is not suitable for monitoring the uptime of the application for monthly/quarterly/yearly bases.
Pushgateway
Pushgateway allows ephemeral and batch jobs to expose their metrics to Prometheus. Since these kinds of jobs may not exist long enough to be scraped, they can instead push their metrics to a Pushgateway. The Pushgateway then exposes these metrics to Prometheus.
Slack Integration
Slack notifications ensure that alerts reach the relevant teams quickly, enabling swift responses to any issues that may arise. This integration is crucial for maintaining operational awareness and facilitating rapid incident response.
You may find more information in this link.
Benefits Throughout the Product Lifecycle
Development and Deployment
The Cloud Platform accelerates the development and deployment process with managed services, automated workflows, and a comprehensive set of tools. This enables teams to focus more on creating user-centric features and less on managing infrastructure.
Testing and Quality Assurance
By offering isolated testing environments and automated testing capabilities, the Cloud Platform ensures that services are rigorously evaluated against the Service Standard’s quality criteria before they are released to the public.
Security and Compliance
The integration of OPA Gatekeeper and the endorsement by the NCSC highlight the platform’s commitment to security and compliance, making it easier for services to meet stringent security requirements outlined in the Service Standard.
Scaling and Management
With its scalable infrastructure and support for multiple environments, the Cloud Platform ensures that services can adapt to changing demands and remain reliable and responsive, in line with the Service Standard’s requirements.
Conclusion
Adopting the Cloud Platform offers significant advantages for Service Teams striving to meet the Service Standard. By providing a reliable, secure, scalable, and compliant foundation, service teams can significantly enhance their operational efficiency, security posture, and the overall reliability of their services.